Article Text

Abstract
If disaster responses vary in their effectiveness across communities, health equity is affected. This paper aims to evaluate and describe variation in the federal disaster responses to 2017 Hurricanes Harvey, Irma and Maria, compared with the need and severity of storm damage through a retrospective analysis. Our analysis spans from landfall to 6 months after landfall for each hurricane. To examine differences in disaster responses across the hurricanes, we focus on measures of federal spending, federal resources distributed and direct and indirect storm-mortality counts. Federal spending estimates come from congressional appropriations and Federal Emergency Management Agency (FEMA) records. Resource estimates come from FEMA documents and news releases. Mortality counts come from National Oceanic and Atmospheric Administration (NOAA) reports, respective vital statistics offices and news articles. Damage estimates came from NOAA reports. In each case, we compare the responses and the severity at critical time points after the storm based on FEMA time logs. Our results show that the federal government responded on a larger scale and much more quickly across measures of federal money and staffing to Hurricanes Harvey and Irma in Texas and Florida, compared with Hurricane Maria in Puerto Rico. The variation in the responses was not commensurate with storm severity and need after landfall in the case of Puerto Rico compared with Texas and Florida. Assuming that disaster responses should be at least commensurate to the degree of storm severity and need of the population, the insufficient response received by Puerto Rico raises concern for growth in health disparities and increases in adverse health outcomes.
- public health
This is an open access article distributed in accordance with the Creative Commons Attribution Non Commercial (CC BY-NC 4.0) license, which permits others to distribute, remix, adapt, build upon this work non-commercially, and license their derivative works on different terms, provided the original work is properly cited, appropriate credit is given, any changes made indicated, and the use is non-commercial. See: http://creativecommons.org/licenses/by-nc/4.0/.
Statistics from Altmetric.com
Summary box
Hurricanes Harvey, Irma and Maria hit the USA with impressive destructive force in a short period of time in 2017.
Despite many similarities, the storms had different effects, with the c. 2975 casualties attributed to Maria in Puerto Rico far exceeding those of Irma in Florida and Harvey in Houston.
There has been considerable dispute in American politics since then about whether the federal government, under President Donald Trump, responded adequately to Hurricane Maria.
The US federal government responded unequally to the three hurricanes, spending more money and resources more expediently for Harvey and Irma compared with Maria, ultimately detrimental to Puerto Rico with probable effects on long-term health and other inequities.
All professionals and institutions, when preparing for disasters, should recognise the extent to which all aspects of public health and disaster response are subject to politics and governmental priorities and may result in differentiated governmental action not aligned with need.
Introduction
2017 was a remarkable year of natural disasters in the USA. Hurricane season is nothing new, but amidst a changing climate, the severity of storms and the magnitude of their damage presents new threats and challenges to public health. Between 19 August and 19 September, three hurricanes hit the southern USA.1 Hurricane Harvey formed on 17 August 2017, and lasted over a week, with the majority of the flooding and damage concentrated in Houston, Texas, USA. Harvey caused widespread flooding and left hundreds of thousands of people without electricity. Hurricane Irma formed on 30 August, the most intense part of the storm hitting northern Caribbean islands and Key West in Florida. In the USA, Irma caused strong wind damage, intermittent electrical damage across Florida and millions of dollars in agricultural damage. Finally, Hurricane Maria formed on 16 September in the Caribbean, focusing its destruction on Dominica and the US territory of Puerto Rico. In Puerto Rico, Maria caused widespread destruction of the power grid, vegetation and housing.
The storms wreaked havoc, destroying lives and infrastructure, with lasting consequences for public health, mental health and long-term physical health outcomes including depression, post-traumatic stress disorder, disability and vector-borne diseases due to prolonged flooding.2–4 What stands apart, however, and has not been discussed by the public health community, is the differential treatment received in each case from the US federal disaster response efforts. There are many different reasons why the responses may have been different—geography, disaster fatigue and/or issues of citizenship and race/ethnicity. However, most critically and irrevocably, disaster responses that differ substantially for reasons other than storm severity and needs of the affected area may affect the public health as well as the health equity of the individuals and communities living through the disaster and the recovery.
This work is limited by data constraints. We used all data publicly available to establish comprehensive timelines of staff and funding directed from Federal Emergency Management Agency (FEMA) to hurricane-affected areas. However, the data was not reported by FEMA in consistent time increments. To establish more consistent timelines and complete gaps in the data, we were in contact with FEMA to request staffing and funding counts across time periods. FEMA did not respond to data requests.
To examine differences in disaster responses across the three hurricanes, we focus on measures of federal spending, federal resources distributed and direct and indirect storm-mortality counts. Federal spending estimates come from congressional appropriations and FEMA records. Resource estimates come from FEMA documents and news releases. Mortality counts come from National Oceanographic and Atmospheric Administration (NOAA) reports, respective vital statistics offices and news reports. Damage estimates came from NOAA reports. In each case, we compare the responses and the severity at critical time points after the storm.
Disparities in the federal hurricane responses
Our results show that the federal response was faster and more generous across measures of money and staffing to Hurricanes Harvey and Irma in Texas and Florida, compared with Hurricane Maria in Puerto Rico. This result would be unsurprising if Hurricane Maria was less damaging than Irma and Harvey. However, Hurricanes Harvey and Irma made landfall as category four hurricanes,1 5 and Maria hit Puerto Rico as a ‘high-end’ category 4, or just below the threshold of a category 5 hurricane.6 Maria caused more damage in Puerto Rico than Irma in Florida or Harvey in Texas in terms of loss of electricity and housing destruction,1 5 6 with overall damage estimates comparable to Harvey, and greater than estimates for Irma.1 Assuming that infrastructure costs are higher in Texas and Florida, and therefore more expensive to repair, compared with Puerto Rico, the high damage estimates in Puerto Rico emphasise the severity of storm damage. Thus, assuming that disaster responses should be commensurate to the degree of storm severity and need of the population, the federal response is questionable and the degree of variation between the disaster responses is problematic.
Figure 1 shows measures of FEMA dollars awarded to individuals and families by the number of days after landfall. Within the first 9 days after the hurricanes hit, both Harvey and Irma survivors had already each received nearly US$100 million in FEMA dollars awarded to individuals and families, whereas Maria survivors had only received slightly over US$6 million in recovery aid. Within the first 2 months post-landfall, Harvey and Irma survivors each received nearly US$1 billion (figure 1, Harvey US$1.28 billion and Irma US$899 million). Maria funds did not hit 1 billion until 4 months after landfall. The same trend holds for total federal dollars received by survivors, including FEMA dollars, national flood-insurance payouts and loans from the Small Business Association.

Cumulative dollars scaled in millions. For example, 5480 million dollars is equal to 5.48 billion dollars. Federal Emergency Management Agency (FEMA) money refers to FEMA assistance to individuals and families.21 This includes applications by individuals currently residing in the USA post-Maria, as well as persons in Puerto Rico. In Survivor’s Pockets includes total count of federal aid to survivors by days post-landfall, including FEMA aid to individuals and families, Small Business Association Loans and National Flood Insurance payouts.22 Data references included in the online supplementary appendix 1. The authors recognise that line plots are the standard for reporting temporal data. Due to the gaps in data available from FEMA, line plots did not read well. The authors chose to instead report the data in bar charts in a series of critical time points.
Supplemental material
Federal staffing can also indicate response to natural disasters and is critical to recovery efforts, acutely in terms of rescue, as well as long-term stabilisation. Examples of staffing efforts include FEMA employees and the National Guard. Long-term staffing efforts are determined by ongoing need for recovery and repair. Figure 2 shows staffing levels by the number of days post-landfall. Within 9 days of landfall, there were 30 000 federal employees posted in Texas, 16 200 posted in Florida and 10 000 posted in Puerto Rico. At the peak, 19 000 federal employees were posted in Puerto Rico, 1 month after landfall, well short of the peak for Texas of 31 000. The amount of food, water, tarps and helicopters were lower and slower for delivery in Puerto Rico then their counterparts in Texas and Florida.7 8
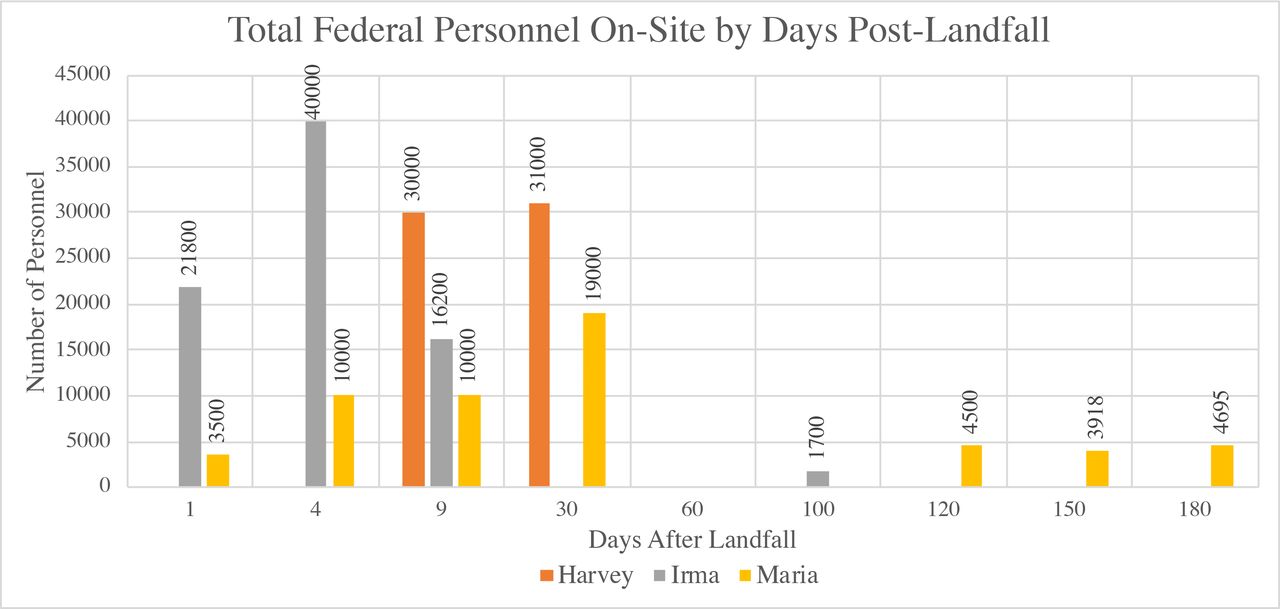
This figure uses all data currently available from Federal Emergency Management Agency (FEMA) hurricane recovery progress records. If data is not recorded for a marked time point, this does not indicate a zero, but an absence of that data. Data references included in the online supplementary appendix. The authors recognise that line plots are the standard for reporting temporal data. Due to the gaps in data available from FEMA, line plots did not read well. The authors chose to instead report the data in bar charts in a series of critical time points.
Differences in responses to the hurricanes are also evident in the delivery and timing of federally appropriated funds to affected communities. Figure 1 above shows the delivery of part of the federally appropriated funds to affected communities as designated through intended agencies. Overall, congress responded to the disasters across the course of three separate spending bills from September to December 2017. In September 2017, Congress authorised US$15.25 billion in Hurricane Harvey and Irma disaster aid, with US$7.4 billion allocated for FEMA’s Disaster Relief Fund, US$450 million for the SBA’s Disaster Loans Program Account and US$7.4 billion for HUD’s Community Development Block Grant (CDBG) programme to support local relief for Irma and Harvey.9 The second bill was passed on 26 October 2017, providing additional supplemental appropriations for disaster relief requirements for all three hurricanes.10 The bill provided US$18.67 billion for the Disaster Relief Fund, where US$10 million must be transferred to the Department of Homeland Security Office of Inspector General for audits and investigations related to disasters and cancelled US$16 billion of the debt held by the National Flood Insurance Program.10 In this October bill, up to US$4.9 billion was allocated for Puerto Rico in the form of a Community Disaster Loan, as opposed to the CDB grants allocated in September to Texas and Florida.10 11 On 9 January, Puerto Rico was denied that US$4.9 billion loan from the October bill, for having a cash balance deemed too high to receive the loan, with the Treasury Department seeking further proof of lack of liquidity.12 The third bill, which was passed in both chambers in December but was not signed until 9 February 2018, contributed to the delayed payout in funds to Puerto Rico.13 Sec. 21 210 of the third bill established that the Governor of Puerto Rico must establish a 12-month and 24-month recovery plan14 endorsed by the Oversight Board15 established under Puerto Rico Oversight, Management and Economic Stability Act requiring monthly reports to Congress. Texas and Florida are able to receive funds without conditional approval of recovery plans.
The Trump Administration often argues that the delay of money and goods to Puerto Rico is based on geographic limitations. Yet, disaster appropriation funding to Puerto Rico took over 4 months post-landfall to reach a comparable amount of money received by Florida and Texas in half the amount of time. The additional 2 months to distribute critical aid is not likely explained by geography, but likely a product of the congressional negotiations outlined above, seeking to demonstrate that Puerto Rico had no sufficient assets to deploy and required financial assistance. Similarly, federal staffing rates in Puerto Rico reached comparable levels in three times the amount of time as Texas and 30 times the amount of time for Irma. The magnitude of this variation seems difficult to explain by geography, particularly in the context of an ongoing disaster.
This analysis was not able to find estimates of medical expenses or personnel supporting Puerto Ricans on the ground in the USA after relocation to mainland US after Maria struck. Many Puerto Ricans now living on the mainland were presumed to enrol in Medicaid if eligible to cover medical costs.16 17 The estimates provided here of federal dollars distributed to survivors include money distributed to all Puerto Rican applicants, whether relocated to mainland US or still residing in Puerto Rico. The data showing FEMA aid to individuals and families includes rental assistance to Puerto Ricans now living in the continental US after Maria.
All of this is underscored by the mortality counts across each hurricane. Hurricane deaths are measured by direct and indirect deaths. NOAA defines direct deaths as ‘[d]eaths occurring as a direct result of the forces of the tropical cyclone’.1 These would include individuals who drowned in storm surge, rough seas, rip currents and freshwater floods.1 Indirect deaths are defined as, ‘[d]eaths occurring from such factors as heart attacks, house fires, electrocutions from downed power lines, vehicle accidents on wet roads, etc.’1 As shown in figure 3, Hurricane Harvey was responsible for 68 direct deaths and5 35 indirect deaths from electrocution, motor-vehicle crashes and isolation from necessary medical services.5 Hurricane Irma caused a total of seven direct deaths, with an additional 85 indirect deaths.1 Of the deaths Irma caused that occurred in the USA, four direct deaths and 80 indirect deaths were in Florida.1 The indirect deaths were primarily caused by falls during preparations for Irma’s approach, vehicle accidents, carbon monoxide poisoning from generators, chainsaw accidents and electrocutions, with 14 occurring from overheating due to air conditioner failure in a nursing home.1

Indirect deaths for Maria are 6 months post-landfall,18 actual deaths may be higher over extended time frame.6 19 23 Indirect deaths for Harvey and Irma are totals; ongoing death counts after the storm are not significantly different from previous years, indicating that the totals for indirect deaths are correct.1 5 Deaths/mortality counts in the data and in the article text refer to absolute deaths (not mortality rates as number of deaths per unit person-time). Data references included in the online supplementary appendix.
For Hurricane Maria in Puerto Rico, NOAA notes that the death toll is highly uncertain. The count for direct deaths by the federal government at this time is 65, with federal reports listing an unknown number for indirect deaths.6 The Puerto Rican Government and George Washington University reviewed mortality data, and in August 2019 released updated, official mortality estimates.18 Total excess mortality is used as the current, most accurate available proxy for indirect deaths from Hurricane Maria. It is a modelled number based on changes in the mortality rate predisaster and postdisaster rather than careful examination of death certificates, due to inaccuracies in reporting cause of death on death certificates in Puerto Rico. This research indicates that total excess mortality post-landfall between September 2018–February 2018 total 2975.18 The risk of death was found to be 45% higher, persisting through the end of the study period for individuals living in municipalities of low socioeconomic development,18 greatly exacerbating pre-existing health inequalities. There have been no other substantial changes in acute threats to mortality besides Hurricane Maria that may account for the significant increase in deaths immediately post-landfall.18 19 Even taking the official death toll at face value, the mortality counts for Maria—as an indicator of need and severity—are commensurate with both Harvey and Irma, requiring a response at least on par with both prior responses. Considering the severe undercount of indirect deaths associated with Maria, the federal response has been inadequate.
Conclusion
This paper demonstrates that the disaster responses to hurricanes Harvey, Irma and Maria were different to the degree that they do not align with storm severity or prevention and recovery needs and may substantially affect deaths and recovery rates. Increases in mortality and adverse health outcomes due to differentiated disaster response and recovery efforts may promote inequity among populations that receive less aid.
There may be many different reasons why the federal response varied in each case. Ability to access the affected area based on geography and distance, existing infrastructure aiding or acting as barriers to response efforts, disaster fatigue, as well as issues of racial bias and perceptions of differential citizenship all may have affected the appropriation and delivery of resources and funding to affected areas in each hurricane. Different mechanisms for the varied responses may be more or less justified. However, what cannot be contested is that the responses were in fact different across critical time points, and these differences have serious consequences for acute and long-term health outcomes and recovery efforts. One of the first appropriations of federal money in the history of the USA was for disaster aid relief, emphasising the critical importance of the federal government’s responsibility to aid its citizens in the case of natural disasters.20
Footnotes
Handling editor Seye Abimbola
Contributors CW, the guarantor, affirms that this manuscript is an honest, accurate and transparent account of the study being reported that no important aspects of the study have been omitted and that any discrepancies from the study as planned have been explained. All authors jointly conceptualised the study. CW and PS conducted the research. CW wrote the article. CW and PS conducted the research. All authors reviewed and amended the final draft. All authors jointly conceptualised the study. All authors reviewed and amended the final draft.
Funding The authors have not declared a specific grant for this research from any funding agency in the public, commercial or not-for-profit sectors.
Competing interests None declared.
Patient consent for publication Not required.
Provenance and peer review Not commissioned; externally peer reviewed.
Data sharing statement No additional data are available.